Introduction
Scalability is a critical aspect of modern applications, especially those handling large volumes of data traffic and high levels of concurrency. As user demands and workloads fluctuate, scalable systems ensure consistent performance, reliability, and responsiveness. By optimizing resource allocation, implementing dynamic scaling mechanisms, and fine-tuning application configurations, we can effectively handle peak loads, reduce latency, and maintain cost efficiency.
Problem
It’s not uncommon for developers to encounter applications (especially legacy ones) that experience more chronic issues, including frequent CPU usage often reaching over 100%, which leads to the application being terminated by k8s (assuming Kubernetes is used as the orchestrator for the application instances being worked on). This, combined with the absence of KEDA (for example) for dynamic scaling, suboptimal Java heap size and garbage collector settings, and outdated pod resource allocations, results in inefficient resource utilization, performance degradation, and instability under high workloads.
Solution
To address the identified challenges, we can implement several important solutions designed to improve application scalability, performance, and stability:
- KEDA Implementation: We integrated Kubernetes Event-driven Autoscaling (KEDA) to enable dynamic scaling of pods based on workload demands. This ensures that the application can handle varying traffic patterns efficiently, reducing resource wastage during low demand and preventing performance degradation during peak loads.
- Java Heap and Garbage Collector Configuration: We optimized the Java heap size and fine-tuned the garbage collection strategy to improve memory management and reduce latency. These adjustments help the application handle high concurrency and large data traffic more effectively.
- Pods Resources (Requests and Limits): We reviewed and updated the CPU and memory requests/limits for pods to ensure optimal resource allocation. This prevents over-provisioning or under-provisioning of resources, improving both cost efficiency and application stability.
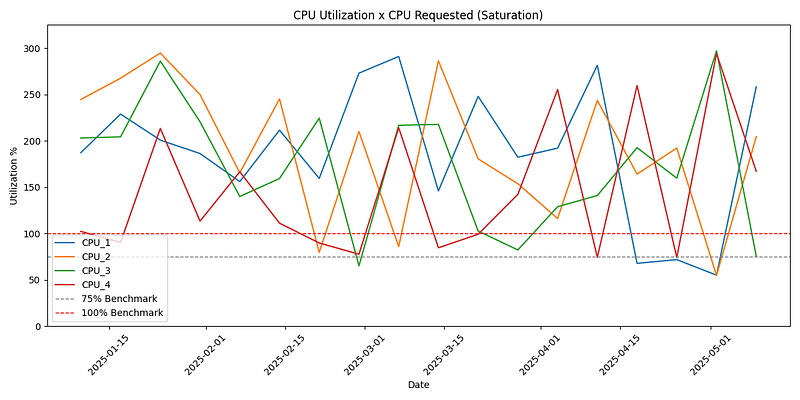
These solutions collectively enhance the application’s ability to scale dynamically, maintain consistent performance under high workloads, and optimize resource utilization. Below is the real-world gains from an application I had the opportunity to work on with the team, implementing configuration and resource utilization improvements. The graph shows a 120-day history, with the improvements implemented around April 15th. The improvement is significant, going from an average utilization of 200% to 25%, with only a few extreme peaks (where improvements can still be made regarding pod scale and health checks, for example):

Configurations - Step by Step
Keda (Kubernetes Event-driven Autoscaling)
- What is?
KEDA (Kubernetes Event-driven Autoscaling) is a Kubernetes-based tool that enables applications to scale dynamically based on custom metrics or external event sources. It works by monitoring specified triggers (e.g., CPU, memory, or external systems like message queues) and adjusting the number of pods accordingly. KEDA integrates with Kubernetes’ Horizontal Pod Autoscaler (HPA) to manage scaling. - How to configure?
- Install KEDA: Deploy KEDA in your Kubernetes cluster using Helm or YAML manifests. Define a ScaledObject: Create a keda-scaledobject.yaml file to specify the scaling behavior for your application. This file links to the target deployment or rollout and defines scaling triggers.
- Integrate with Java Application: Ensure your Java application exposes metrics (e.g., CPU, memory) or integrates with external systems (e.g., SQS) that KEDA can monitor.
- Deploy in Kubernetes: Deploy the application with proper resource requests/limits defined in the pod specification.
- Install KEDA: Deploy KEDA in your Kubernetes cluster using Helm or YAML manifests. Define a ScaledObject: Create a keda-scaledobject.yaml file to specify the scaling behavior for your application. This file links to the target deployment or rollout and defines scaling triggers.
- Example
Example keda-scaledobject.yaml
The following YAML file configures KEDA to scale a Java application based on CPU and memory utilization:
apiVersion: keda.sh/v1alpha1
kind: ScaledObject
metadata:
  name: "java-app-scaled-object"
  namespace: "your-namespace"
spec:
  scaleTargetRef:
    apiVersion: apps/v1
    kind: Deployment
    name: java-app
  minReplicaCount: 2
  maxReplicaCount: 10
  cooldownPeriod: 60
  advanced:
    horizontalPodAutoscalerConfig:
      behavior:
        scaleUp:
          stabilizationWindowSeconds: 0
          policies:
            - type: Percent
              value: 50
              periodSeconds: 30
            - type: Pods
              value: 1
              periodSeconds: 15
        scaleDown:
          stabilizationWindowSeconds: 300
          policies:
            - type: Pods
              value: 2
              periodSeconds: 60
  triggers:
    - type: cpu
      metadata:
        type: Utilization
        value: "70"
    - type: memory
      metadata:
        type: Utilization
        value: "70"
This configuration ensures that the application scales between 2 and 10 replicas based on CPU and memory usage, with a target utilization of 70%.
- Configuration attributes
The advanced attributes in the horizontalPodAutoscalerConfig section of a KEDA ScaledObject allow fine-grained control over how scaling occurs. Here’s an explanation of each attribute:
- HorizontalPodAutoscalerConfig:
This section customizes the behavior of the Horizontal Pod Autoscaler (HPA) used by KEDA. It allows you to define specific scaling behaviors for both scaling up and scaling down. - Behaviour:
The behavior attribute defines how the HPA should scale pods in response to changes in metrics. It contains two sub-sections:- scaleUp: Configures how the application scales up (adds pods).
- scaleDown: Configures how the application scales down (removes pods).
- ScaleUp and ScaleDown:
These attributes define the scaling policies for increasing or decreasing the number of pods. Each contains:- stabilizationWindowSeconds: The time (in seconds) the HPA waits before applying a new scaling decision. This prevents rapid fluctuations in pod count.
- default: 0 seconds for scaleUp, 300 seconds for scaleDown.
- default: 0 seconds for scaleUp, 300 seconds for scaleDown.
- policies: A list of rules that define how scaling occurs. Each policy has:
- type: The type of scaling, either Pods (fixed number of pods) or Percent (percentage of current pods).
- value: The amount to scale by (number of pods or percentage).
- periodSeconds: The time window (in seconds) over which the policy is evaluated.
- stabilizationWindowSeconds: The time (in seconds) the HPA waits before applying a new scaling decision. This prevents rapid fluctuations in pod count.
- Default Behavior of Policies
If no policies are specified:- scaleUp: Adds up to 4 pods or 100% of the current pod count every 15 seconds.
- scaleDown: Removes up to 1 pod or 10% of the current pod count every 15 seconds.
- Example and explanation
- HorizontalPodAutoscalerConfig:
advanced:
  horizontalPodAutoscalerConfig:
    behavior:
      scaleUp:
        stabilizationWindowSeconds: 0
        policies:
          - type: Percent
            value: 50
            periodSeconds: 30
          - type: Pods
            value: 2
            periodSeconds: 15
      scaleDown:
        stabilizationWindowSeconds: 300
        policies:
          - type: Pods
            value: 1
            periodSeconds: 60
          - type: Percent
            value: 20
            periodSeconds: 60
- scaleUp:
- No stabilization window (stabilizationWindowSeconds: 0).
- Can scale up by 50% of the current pod count every 30 seconds.
- Alternatively, can scale up by 2 pods every 15 seconds.
- scaleDown:
- Stabilization window of 300 seconds to avoid rapid scale-downs.
- Can scale down by 1 pod every 60 seconds.
- Alternatively, can scale down by 20% of the current pod count every 60 seconds.
- This configuration ensures controlled and predictable scaling behavior, avoiding sudden spikes or drops in pod count.
- IMPORTANT:
- When you have multiple scaling policies defined (Percent, Pods… etc), you need to configure or understand the default of which policy will be applied first. Therefore, the selectPolicy attribute exists for this purpose. The selectPolicy attribute in the horizontalPodAutoscalerConfig section of a KEDA ScaledObject specifies how to choose a scaling policy when multiple policies are defined. It determines which policy to apply when there are multiple valid options.
- Possible Values for selectPolicy
- Max: Selects the policy that results in the largest scaling adjustment.
- Min: Selects the policy that results in the smallest scaling adjustment.
- Disabled: Disables the use of multiple policies, meaning no scaling occurs if multiple policies are defined.
- Possible Values for selectPolicy
- Default Behavior: If selectPolicy is not specified, the default value is Max, meaning the policy with the largest scaling adjustment is applied.
- Example and explanation
Here’s an example of how to use selectPolicy:
- Example and explanation
- When you have multiple scaling policies defined (Percent, Pods… etc), you need to configure or understand the default of which policy will be applied first. Therefore, the selectPolicy attribute exists for this purpose. The selectPolicy attribute in the horizontalPodAutoscalerConfig section of a KEDA ScaledObject specifies how to choose a scaling policy when multiple policies are defined. It determines which policy to apply when there are multiple valid options.
advanced:
  horizontalPodAutoscalerConfig:
    behavior:
      scaleUp:
        stabilizationWindowSeconds: 0
        selectPolicy: Min
        policies:
          - type: Percent
            value: 50
            periodSeconds: 30
          - type: Pods
            value: 2
            periodSeconds: 15
      scaleDown:
        stabilizationWindowSeconds: 300
        selectPolicy: Max
        policies:
          - type: Pods
            value: 1
            periodSeconds: 60
          - type: Percent
            value: 20
            periodSeconds: 60
- scaleUp: selectPolicy: Min: The policy with the smallest adjustment (e.g., 2 pods or 50% of the current pod count) will be applied. (If the current pod count is 2, the first policy to be triggered if necessary would be the percentage policy, since 50% of 2 is 1, 1 more pod would be deployed and not 2 as the number of pods policy dictates. Remember that selectPolicy Min gives priority to the policy that affects the smallest number of pods first. The next scale, if necessary again, would evaluate 50% of 3 pods (2 initial + 1 that had already been scaled), and the result would be 1.5, but k8s rounds this number up so it would deploy 2 more pods totaling 5. From here on, if it were necessary to scale again, the percentage policy would evaluate the 50% as 2.5 pods rounding to 3, which would no longer execute the percentage policy but the pod policy, since as selectPolicy is Min the correct thing to do is to make the smallest change first (thus deploying 2 pods and not 3).)
- scaleDown: selectPolicy: Max: The policy with the largest adjustment (e.g., 1 pod or 20% of the current pod count) will be applied. (The same thing that was explained in scaleUp applies here, but with the opposite logic, always triggering first the policy that affects the largest number of pods, since in the scaleDown example the selectPolicy was configured as Max)
- This allows fine-tuned control over how scaling decisions are made when multiple policies are defined.
KEDA official documentation
- homepage: https://keda.sh/
- possible scalers: https://keda.sh/docs/2.16/scalers/
- cpu scaler example: https://keda.sh/docs/2.16/scalers/cpu/
Pods Resources
- What is?
In Kubernetes, pod resources (requests and limits) define how much CPU and memory a pod can use.- Requests: The minimum guaranteed resources a pod needs to run. The scheduler uses this to decide which node can host the pod.
- Limits: The maximum resources a pod can consume. If exceeded, the pod may be throttled (CPU) or terminated (memory).
This ensures efficient resource allocation and prevents resource contention.
- How to configure?
To configure requests and limits for a pod in Kubernetes, you define them in the resources section of the container specification in the pod’s YAML file (in our case, values.yaml):- Requests: Specify the minimum guaranteed CPU and memory resources (do not overdo the amount of request resources, as they are pre-allocated and are unavailable to other applications in the cluster).
- Limits: Set the maximum CPU and memory resources the container can use (unlike request resources, what was allocated for the limit — between the request and the limit — remains available in the cluster and will only be used after the request level is exceeded, being returned to the cluster when it is no longer needed).
- Example
Example values.yaml
app:
  name: example-app
  replicas: 2
  image:
    repository: example-app
    tag: latest
  resources:
    requests:
      cpu: "500m" # Minimum CPU guaranteed
      memory: "256Mi" # Minimum memory guaranteed
    limits:
      cpu: "1" # Maximum CPU allowed
      memory: "512Mi" # Maximum memory allowed
  env:
    - name: ENVIRONMENT
      value: production
This configuration ensures that each pod has a minimum of 500m CPU and 256Mi memory guaranteed, with a maximum limit of 1 CPU and 512Mi memory.
- Resource measurement units (see the examples in the code snippet above)
- In Kubernetes, CPU and memory quantities can be specified using specific units:
- CPU Units
- Millicores: Represented as m. For example:
500m = 0.5 CPU cores
1000m = 1 CPU core - Cores: Represented as a plain number. For example:
1 = 1 CPU core
2.5 = 2.5 CPU cores
- Millicores: Represented as m. For example:
- CPU Units
- In Kubernetes, CPU and memory quantities can be specified using specific units:
- Memory Units
- Binary SI (Base 2): Uses powers of 1024. For example:
Mi (Mebibytes): 128Mi, 512Mi
Gi (Gibibytes): 1Gi, 2Gi
Ki (Kibibytes): 64Ki - Decimal SI (Base 10): Uses powers of 1000. For example:
M (Megabytes): 128M, 512M
G (Gigabytes): 1G, 2G
K (Kilobytes): 64K
- Binary SI (Base 2): Uses powers of 1024. For example:
K8s documentation
- resource management: https://kubernetes.io/docs/concepts/configuration/manage-resources-containers/
So now, in addition to properly configuring the pods and triggers, it’s essential to look inside the JVM — especially at the Garbage Collector and the heap.
Java Heap
- What is?
The Java Heap Memory is the portion of memory allocated to the Java Virtual Machine (JVM) for storing objects and class instances during the runtime of an application. It is the primary area where dynamic memory allocation occurs and is shared among all threads in the application.- Key Characteristics:
- Divided into Generations:
- Young Generation: Stores short-lived objects, such as temporary variables. It includes the Eden and Survivor spaces.
- Old Generation (Tenured): Stores long-lived objects that survive multiple garbage collection cycles.
- Metaspace: Stores metadata about classes and methods (introduced in Java 8, replacing PermGen).
- Divided into Generations:
- Key Characteristics:
- Garbage Collection (the process): The JVM automatically manages memory in the heap using garbage collection to reclaim memory from objects no longer in use.
Configurable Size: The heap size can be adjusted using JVM options like -Xms (initial size) and -Xmx (maximum size). In the next topic we will cover the Garbage Collector, the agent that executes the Garbage Collection process.
IMPORTANT: Heap memory is critical for application performance and stability. Insufficient heap memory can lead to OutOfMemoryError, while excessive heap usage can cause frequent garbage collection, impacting performance.
- How to configure?
- To configure the Java heap memory, you can use the JVM options -Xms (to set the initial/minimum heap size) and -Xmx (to set the maximum heap size). These options are typically specified when starting a Java application.
- Example syntax:
- To configure the Java heap memory, you can use the JVM options -Xms (to set the initial/minimum heap size) and -Xmx (to set the maximum heap size). These options are typically specified when starting a Java application.
java -Xms<min_heap_size> -Xmx<max_heap_size> -jar <application>.jar
- Examples with different values
- Set Minimum Heap to 512 MB and Maximum Heap to 1 GB:
java -Xms512m -Xmx1024m -jar myapp.jar
- Examples with same values
- Set Minimum and Maximum Heap to the Same Value (e.g., 2 GB): This ensures the heap size does not grow or shrink dynamically.
java -Xms2g -Xmx2g -jar myapp.jar
- IMPORTANT:
Use m for megabytes and g for gigabytes.
Ensure the heap size values are appropriate for your system’s available memory (cluster memory in our case) to avoid OutOfMemoryError or system instability. - In addition to -Xms and -Xmx for configuring the Java heap memory, the JVM provides several other options for fine-tuning memory management. These options allow developers to optimize memory usage based on application requirements and system resources. Here are some key variables:
- MaxRAMPercentage
Specifies the maximum percentage of the total system memory that the JVM can use for the heap.
Useful in containerized environments where memory limits are dynamic.- Default: 25% of the total system memory.
- Example: java -XX:MaxRAMPercentage=50.0 -jar myapp.jar
- InitialRAMPercentage
Specifies the initial percentage of the total system memory to allocate for the heap.
Works similarly to -Xms but as a percentage.- Example: java -XX:InitialRAMPercentage=10.0 -jar myapp.jar
- Example: java -XX:InitialRAMPercentage=10.0 -jar myapp.jar
- MinRAMPercentage
Specifies the minimum percentage of the total system memory that the JVM will use for the heap.- Example: java -XX:MinRAMPercentage=20.0 -jar myapp.jar
- Example: java -XX:MinRAMPercentage=20.0 -jar myapp.jar
- -XX:MetaspaceSize and -XX:MaxMetaspaceSize
Control the size of the Metaspace, which stores class metadata.- MetaspaceSize: Initial size of the Metaspace.
- MaxMetaspaceSize: Maximum size of the Metaspace.
- Example: java -XX:MetaspaceSize=128m -XX:MaxMetaspaceSize=512m -jar myapp.jar
- -XX:NewRatio
Sets the ratio between the Young Generation and the Old Generation.- Example: -XX:NewRatio=2 means the Old Generation is twice the size of the Young Generation.
- Example: java -XX:NewRatio=3 -jar myapp.jar
- -XX:SurvivorRatio
Sets the ratio between the Eden space and the Survivor spaces in the Young Generation.- Example: -XX:SurvivorRatio=8 means the Eden space is 8 times larger than each Survivor space.
- Example: java -XX:SurvivorRatio=6 -jar myapp.jar
- -XX:MaxDirectMemorySize
Specifies the maximum size of direct memory (used by NIO buffers).- Default: Same as the maximum heap size.
- Example: java -XX:MaxDirectMemorySize=256m -jar myapp.jar
- -XX:GCTimeRatio
Controls the ratio of time spent in garbage collection versus application execution.- Example: -XX:GCTimeRatio=4 means the JVM will spend at most 1/5th of the time in garbage collection.
- Example: java -XX:GCTimeRatio=4 -jar myapp.jar
- -XX:InitiatingHeapOccupancyPercent
Specifies the percentage of the heap occupancy at which a garbage collection cycle is triggered.- Example: java -XX:InitiatingHeapOccupancyPercent=45 -jar myapp.jar
- Example: java -XX:InitiatingHeapOccupancyPercent=45 -jar myapp.jar
- -XX:ParallelGCThreads
Sets the number of threads used for parallel garbage collection.- Example: java -XX:ParallelGCThreads=8 -jar myapp.jar
- Example: java -XX:ParallelGCThreads=8 -jar myapp.jar
- MaxRAMPercentage
- IMPORTANT:
These options are highly dependent on the application workload and the environment (e.g., containerized or bare-metal systems).
Always test and monitor the application after applying these settings to ensure optimal performance.- Example
- Example configmap.yaml
apiVersion: v1
kind: ConfigMap
metadata:
  name: java-opts-config
  namespace: default
data:
  JAVA_OPTS: >
    -Xms512m
    -Xmx1024m
    -XX:MaxRAMPercentage=75.0
    -XX:InitialRAMPercentage=25.0
    -XX:MinRAMPercentage=20.0
    -XX:+UseG1GC
    -XX:InitiatingHeapOccupancyPercent=45
    -XX:MaxMetaspaceSize=256m
    -XX:+HeapDumpOnOutOfMemoryError
    -XX:HeapDumpPath=/tmp/heap-dumps
Garbage Collector
- What is?
The Java Garbage Collector (GC) is a memory management tool within the Java Virtual Machine (JVM) that automatically reclaims memory occupied by objects no longer in use. Its primary purpose is to prevent memory leaks and optimize the application’s memory usage without requiring manual intervention.
- Key Features:
- Automatic Memory Management: The GC identifies and removes unused objects, freeing up memory for new allocations.
- Generational Model: Java divides the heap into generations (Young, Old, and sometimes Metaspace) to optimize garbage collection for objects with different lifecycles.
- Young Generation: Contains short-lived objects. Frequent garbage collections occur here (Minor GC).
- Old Generation: Stores long-lived objects. Garbage collection here is less frequent but more time-consuming (Major GC).
- Garbage Collection Algorithms: Java provides multiple GC algorithms (e.g., G1GC, Parallel GC, ZGC) to balance performance and memory efficiency based on application needs.
- Key Features:
- IMPORTANT:
The Garbage Collector ensures efficient memory usage, reduces the risk of OutOfMemoryError, and simplifies memory management for developers. However, improper tuning or excessive garbage collection can impact application performance, making it essential to monitor and configure the GC appropriately for specific workloads.
- How to configure?
- Here is an example of how to configure the Garbage Collector (GC) for Java applications, based on different Java versions:
- Java 8
In Java 8, the default GC is Parallel GC, but you can configure other collectors like G1GC or CMS.- Example:
- -XX:+UseG1GC: Enables the G1 Garbage Collector.
- -XX:InitiatingHeapOccupancyPercent=45: Triggers GC when 45% of the heap is occupied.
- java -XX:+UseG1GC -XX:InitiatingHeapOccupancyPercent=45 -Xms512m -Xmx1024m -jar myapp.jar
- Example:
- Java 17
In Java 17, the default GC is G1GC, but you can configure newer collectors like ZGC or Shenandoah.- Example:
- -XX:+UseZGC: Enables the Z Garbage Collector.
- -XX:SoftRefLRUPolicyMSPerMB=50: Configures soft reference retention for ZGC.
- java -XX:+UseZGC -Xms512m -Xmx1024m -XX:SoftRefLRUPolicyMSPerMB=50 -jar myapp.jar
- Example:
- Java 21 or Greater
In Java 21, ZGC and Shenandoah are highly optimized. You can also use Generational ZGC.- Example:
- -XX:+UseGenerationalZGC: Enables Generational ZGC.
- -XX:MaxHeapFreeRatio=20: Sets the maximum percentage of free heap before shrinking.
- -XX:MinHeapFreeRatio=5: Sets the minimum percentage of free heap before expanding.
- java -XX:+UseGenerationalZGC -Xms512m -Xmx1024m -XX:MaxHeapFreeRatio=20 -XX:MinHeapFreeRatio=5 -jar myapp.jar
- Example:
- Java 8
- Here is an example of how to configure the Garbage Collector (GC) for Java applications, based on different Java versions:
IMPORTANT: When choosing a Garbage Collector, don’t look only at memory — also consider pause profiles and CPU consumption. For example, G1GC usually strikes a good balance between throughput and latency but can consume more CPU under heavy workloads. Parallel GC favors throughput but may lead to longer pauses, while ZGC and Shenandoah deliver extremely short pauses at the cost of higher CPU usage. In latency-sensitive environments, long pauses can be just as harmful as running out of memory. That’s why it’s worth experimenting with different collectors, enabling detailed GC logs (-Xlog:gc*), and measuring not only total collection time but also the impact on application response under real load.
Trade-offs dos Garbage Collectors em ambientes Kubernetes/Java
| Garbage Collector | Pause latency | Typical CPU usage | Best use case |
|---|---|---|---|
| Parallel GC | Long pauses | Lower CPU usage | High throughput, less latency sensitivity |
| G1GC | Medium pauses | Moderate CPU usage | Balanced latency and throughput |
| ZGC / Shenandoah | Very short pauses | Higher CPU usage | Latency-critical apps, fast response required |
Example scenario: GC pauses before and after tuning
During a load test in a sample microservice running on Kubernetes, GC pauses were averaging 450 ms under peak load using G1GC. After switching to ZGC and fine-tuning heap size with -XX:MaxRAMPercentage, the average pause time dropped to under 90 ms — improving the 99th percentile response latency significantly. This shows how experimenting with different collectors and settings can drastically improve performance under stress.
Glossary
- CMS (Concurrent Mark-Sweep): is a deprecated garbage collector in the JVM designed to minimize pause times by performing most of its work concurrently with the application threads. It uses a multi-phase process to mark and sweep unused objects, making it suitable for low-latency applications. However, it has been replaced by newer collectors like G1GC and ZGC in modern Java versions.
- Shenandoah: is a low-pause garbage collector introduced in the JVM. It focuses on reducing pause times by performing most of its work concurrently with the application threads. Shenandoah is particularly useful for applications requiring consistent low-latency performance.
- Generational ZGC: is an enhancement of the Z Garbage Collector introduced in Java 21. It divides the heap into generations (Young and Old) to optimize garbage collection for objects with different lifecycles. This approach improves performance by focusing frequent collections on short-lived objects in the Young Generation while handling long-lived objects in the Old Generation less frequently.
- Soft Reference Retention: Soft references in Java are a type of reference that allows objects to be garbage collected only when the JVM is low on memory. The retention policy for soft references can be configured (e.g., -XX:SoftRefLRUPolicyMSPerMB) to control how long these references are kept based on memory usage and time.
- Shrinking: refers to the process where the JVM reduces the heap size when it detects that the application is using less memory. This helps optimize memory usage in environments with limited resources, such as containerized applications.
- Expanding: is the process where the JVM increases the heap size when the application requires more memory. This ensures that the application has sufficient memory to operate without running into OutOfMemoryError.
IMPORTANT:
Always test GC configurations with your application workload to ensure optimal performance.
Use monitoring tools like JVisualVM, JMC, or Prometheus/Grafana to analyze GC behavior.
Oracle garbage collector tuning documentation
- Java 8: Java Platform, Standard Edition HotSpot Virtual Machine Garbage Collection Tuning Guide, Release 8
- Java 17: HotSpot Virtual Machine Garbage Collection Tuning Guide
- Java 21: HotSpot Virtual Machine Garbage Collection Tuning Guide
Tests and Monitoring
But there’s no point in tweaking without measuring. Testing and monitoring are essential to validate whether the changes have actually taken effect.
Monitoring is just as important as configuring. Some metrics I usually keep track of:
- CPU and memory of the pods (requests vs. actual usage) to see if the sizing is consistent.
- Application response latency and throughput to detect bottlenecks or pauses noticeable to users.
- GC metrics: average pause time, collection frequency, survivor memory, and heap usage over time.
- KEDA scaling: number of replicas vs. actual load, checking whether the triggers are reacting properly.
Tools like Prometheus + Grafana (with JVM/GC dashboards), logs in Elasticsearch/Kibana, or even CloudWatch (if you’re on AWS) help visualize this data. The goal is to identify patterns and validate whether changes in heap, GC, or pod resources have truly brought benefits.
Continuous Monitoring and Alerts
It’s not enough to measure once. The real power comes from continuous monitoring under different traffic patterns (normal, peaks, and off-peak) and setting up alerts for key metrics. For example:
- High GC pause alerts (if pause > 200 ms on average).
- Heap usage growth or survivor memory trending up — can indicate a leak or bad tuning.
- Replica mismatch — triggers firing but pods not scaling properly.
This proactive approach helps catch regressions before they impact end-users.
…
At the end of the day, achieving efficient scaling in Java applications running on Kubernetes isn’t just about tweaking a parameter here or there — it’s about understanding how each piece behaves. Well-defined requests and limits prevent surprises, KEDA helps the system automatically react to spikes, and a consciously tuned heap together with the right GC ensures the JVM won’t become the bottleneck. Every environment is different, so it’s worth testing, measuring, and adjusting until you find the sweet spot. Following this approach, your application will tend to be much more stable, predictable, and cost-effective to run, even as traffic grows or changes its pattern.